2. slopegeometry module
Module for defining the class related to the slope geometry.
-
class
slopegeometry.AnthropicSlope(slopeHeight, slopeDip, crownDist, toeDist, maxDepth=None)[source]¶ Bases:
objectCreates an instance of an object that defines the geometrical frame of the slope to perform the analysis.
- The geometry of the slope is as follow:
- It is a right slope, i.e. its face points to the right side.
- Crown and toe planes are horizontal.
- The face of the slope is continuous, ie, it has not berms.
-
slopeHeight¶ int or float – Height of the slope, ie, vertical length betwen crown and toe planes.
-
slopeDip¶ (2, ) tuple, list or numpy.ndarray – Both horizontal and vertical components of the slope inclination given in that order.
-
crownDist¶ int or float – Length of the horizontal plane in the crown of the slope.
-
toeDist¶ int or float – Length of the horizontal plane in the toe of the slope.
Note
The class
slopegeometryrequires NumPy and Matplotlib.Examples
>>> slopeGeometry = AnthropicSlope(12, [1, 1.5], 10, 10)
>>> slopeGeometry.__dict__.keys()
dict_keys(['slopeHeight', 'slopeDip', 'crownDist', 'toeDist',
           'maxDepth', 'boundCoords'])
-
maxDepth()[source] Method to obtain the maximum depth of a slope where a circular slope failure analysis can be performed.
- The maximum depth is such that the biggest circle satisfished the following conditions:
- It is tangent to the bottom.
- crosses both the extreme points at the crown and toe.
- It is orthogonal to the crown plane.
Returns: Maximum depth of the slope measured vertically from the toe plane. Return type: maxDepth (int or float) Examples
>>> slopeGeometry = AnthropicSlope(12, [1, 1.5], 10, 10)
>>> slopeGeometry.maxDepth()
4.571428571428573
-
defineBoundary()[source]¶ Method to obtain the coordinates of the boundary vertices of the slope and plot it if it is wanted.
The origin of the coordinates is in the corner of the bottom with the back of the slope. The coordinates define a close polygon, ie, the first pair of coordinates is the same than the last one.
Returns: Coordinates of the boundary vertices of the slope. Return type: (numpy.ndarray) Examples
>>> slopeGeometry = AnthropicSlope(12, [1, 1.5], 10, 10)
>>> slopeGeometry.defineBoundary()
array([[  0.        ,   0.        ],
       [ 28.        ,   0.        ],
       [ 28.        ,   4.57142857],
       [ 18.        ,   4.57142857],
       [ 10.        ,  16.57142857],
       [  0.        ,  16.57142857],
       [  0.        ,   0.        ]])

-
class
slopegeometry.NaturalSlope(surfaceCoords)[source]¶ Bases:
objectCreates an instance of an object that defines the geometrical frame of the slope to perform the analysis.
- The geometry of the slope is as follow:
- It is a right slope, i.e. its face points to the right side.
- The slope is defined with its surface’s coordinates.
- The surface is defined as a polyline such that each segment’s slope are always zero or negative.
- The coordinates’ order is such that the highest (and leftmost) point is the first one, and the lowest (and rightmost) is the last one.
-
surfaceCoords¶ numpy.ndarray – Coordinates of the surface’s vertices of the slope.
Note
The class
NaturalSloperequires NumPy and Matplotlib.Examples
>>> from numpy import array
>>> surfaceCoords = array([[  0.        ,  16.57142857],
                           [ 10.        ,  16.57142857],
                           [ 18.        ,   4.57142857],
                           [ 28.        ,   4.57142857],
                           [ 28.        ,   0.        ]])
>>> slopeGeometry = NaturalSlope(surfaceCoords)
>>> slopeGeometry.__dict__.keys()
dict_keys(['surfaceCoords', 'slopeHeight', 'maxDepth', 'boundCoords'])
-
maxDepth()[source]¶ Method to obtain the maximum depth of a slope where a circular slope failure analysis can be performed.
- The maximum depth is such that the biggest circle satisfished the following conditions:
- It is tangent to the bottom.
- crosses both the extreme points at the crown and toe.
- It is orthogonal to the crown plane.
Returns: Maximum depth of the slope measured vertically from the toe plane. Return type: maxDepth (int or float) Examples
>>> from numpy import array
>>> surfaceCoords = array([[  0.        ,  16.57142857],
                           [ 10.        ,  16.57142857],
                           [ 18.        ,   4.57142857],
                           [ 28.        ,   4.57142857]])
>>> slopeGeometry = NaturalSlope(surfaceCoords)
>>> slopeGeometry.maxDepth()
4.571428571428573
-
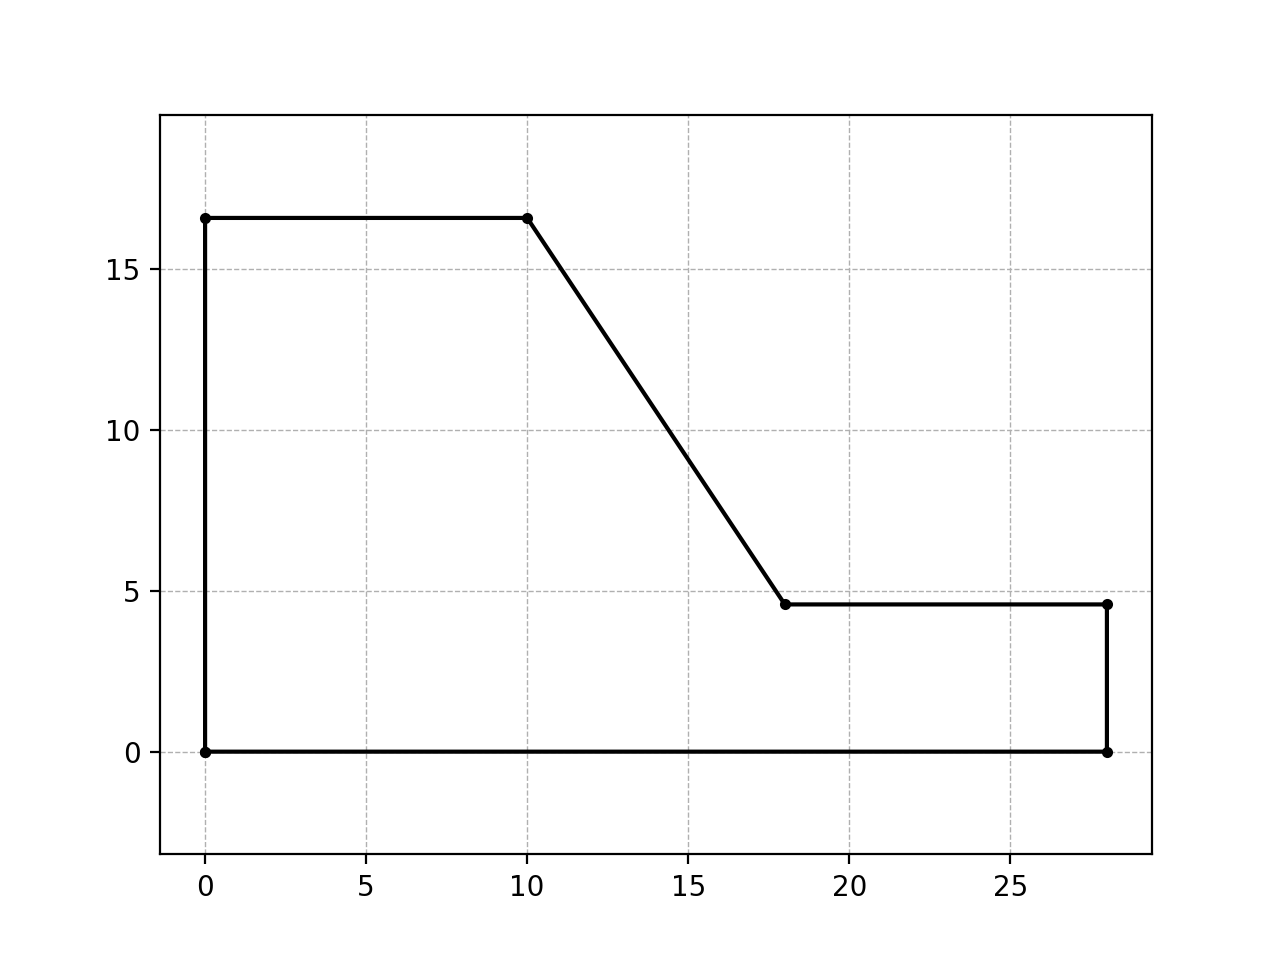
defineBoundary()[source]¶ Method to obtain the coordinates of the boundary vertices of the slope and plot it if it is wanted.
The origin of the coordinates is in the corner of the bottom with the back of the slope. The coordinates define a close polygon, ie, the first pair of coordinates is the same than the last one.
Returns: Coordinates of the boundary vertices of the slope. Return type: (numpy.ndarray) Examples
>>> from numpy import array
>>> surfaceCoords = array([[  0.        ,  16.57142857],
                           [ 10.        ,  16.57142857],
                           [ 18.        ,   4.57142857],
                           [ 28.        ,   4.57142857]])
>>> slopeGeometry = NaturalSlope(surfaceCoords)
>>> slopeGeometry.defineBoundary()
array([[  0.        ,   0.        ],
       [  0.        ,  16.57142857],
       [ 10.        ,  16.57142857],
       [ 18.        ,   4.57142857],
       [ 28.        ,   4.57142857],
       [ 28.        ,   0.        ],
       [  0.        ,   0.        ]])
>>> from numpy import array
>>> surfaceCoords = array([[-2.4900, 18.1614],
                           [0.1022, 17.8824],
                           [1.6975, 17.2845],
                           [3.8909, 15.7301],
                           [5.8963, 14.3090],
                           [8.1183, 13.5779],
                           [9.8663, 13.0027],
                           [13.2865, 3.6058],
                           [20.2865, 3.6058],
                           [21.4347, 3.3231],
                           [22.2823, 2.7114],
                           [23.4751, 2.2252],
                           [24.6522, 1.2056],
                           [25.1701, 0.2488]])
>>> slopeGeometry = NaturalSlope(surfaceCoords)
>>> slopeGeometry.defineBoundary()
array([[  0.00000000e+00,   0.00000000e+00],
       [  0.00000000e+00,   1.96301237e+01],
       [  2.59220000e+00,   1.93511237e+01],
       [  4.18750000e+00,   1.87532237e+01],
       [  6.38090000e+00,   1.71988237e+01],
       [  8.38630000e+00,   1.57777237e+01],
       [  1.06083000e+01,   1.50466237e+01],
       [  1.23563000e+01,   1.44714237e+01],
       [  1.57765000e+01,   5.07452373e+00],
       [  2.27765000e+01,   5.07452373e+00],
       [  2.39247000e+01,   4.79182373e+00],
       [  2.47723000e+01,   4.18012373e+00],
       [  2.59651000e+01,   3.69392373e+00],
       [  2.71422000e+01,   2.67432373e+00],
       [  2.76601000e+01,   1.71752373e+00],
       [  2.76601000e+01,   6.66133815e-16],
       [  0.00000000e+00,   0.00000000e+00]])
-
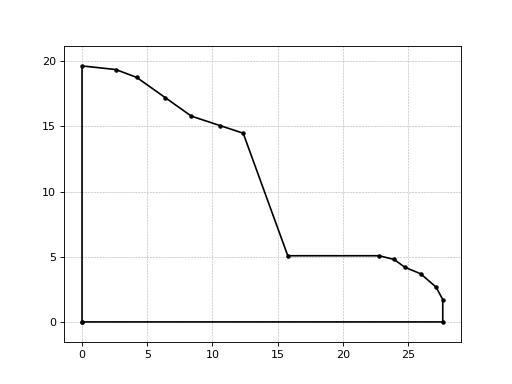
plotSlope()[source]¶ Method for generating a graphic of the slope boundary.
Examples
>>> from numpy import array
>>> surfaceCoords = array([[  0.        ,  16.57142857],
                           [ 10.        ,  16.57142857],
                           [ 18.        ,   4.57142857],
                           [ 28.        ,   4.57142857]])
>>> slopeGeometry = NaturalSlope(surfaceCoords)
>>> slopeGeometry.plotSlope()
(Source code, png, hires.png, pdf)

>>> from numpy import array
>>> surfaceCoords = array([[-2.4900, 18.1614],
                           [0.1022, 17.8824],
                           [1.6975, 17.2845],
                           [3.8909, 15.7301],
                           [5.8963, 14.3090],
                           [8.1183, 13.5779],
                           [9.8663, 13.0027],
                           [13.2865, 3.6058],
                           [20.2865, 3.6058],
                           [21.4347, 3.3231],
                           [22.2823, 2.7114],
                           [23.4751, 2.2252],
                           [24.6522, 1.2056],
                           [25.1701, 0.2488]])
>>> slopeGeometry = NaturalSlope(surfaceCoords)
>>> slopeGeometry.plotSlope()
(Source code, png, hires.png, pdf)
